See what a research-backed GTM deliverable actually looks like
One curated section per phase from the Sagentix internal reference engagement (Sagentix_GTM_2026Q1) — 165 pages total. Each phase: title page · PART I Strategic Context · one or two curated deep-dive sections that show how the analysis is actually done.
Why a 165-page sample?
The deliberate reframe — Problem · Solution · Outcome
Buyers can't evaluate consulting before they buy. Top-tier strategy firms publish 26-65 page Insights reports as marketing — never the actual client deliverable. Boutique firms publish testimonials, not work product.
I ran the full 10-phase Sagentix GTM methodology on my own firm and published one curated section per phase — title page, PART I Strategic Context, plus one or two deep-dives that show how the analysis is actually done.
In 10 minutes you can verify what 8-12 weeks of paid work produces. Read 5 pages or 165 — your choice. The format, sourcing, and 16-point quality gate are unchanged from a paying client's deliverable.
10-Minute Scan Path
Don't have an hour? Read these five pages.
Each one tells you whether the rest of the bundle is worth your time.
p. 5
Phase 01 SCQA
How the brief opens — situation, complication, question, answer.
p. 10
TAM/SAM/SOM funnel
3-filter sizing methodology. The page that proves market math is honest.
p. 112
Business Model Canvas
Nine interlocking blocks. Unit economics. The "could this work" page.
p. 127
90-Day Action Plan
Three 30-day sprints. Six KPIs. Where strategy meets calendar.
p. 153
Master Claims Table
50+ claims classified Verified → Unsubstantiated. The proof discipline.
What you'll receive is one curated section per phase from the 10-phase Sagentix_GTM_2026Q1 internal reference engagement — a real engagement Sagentix ran on itself in April 2026. Format, sourcing, typeface, and the 16-point quality gate are unchanged from what a paying client receives.
Each phase keeps its title page and PART I Strategic Context (Executive Briefing · Methodology · SCQA · Key Takeaways), then drops into one or two deep-dive sections — Bottom-Up TAM/SAM/SOM, Three Kinds of Fit, Business Model Canvas, TCO comparison, Master Claims Table — that show how the analysis is actually done. Each phase's full deliverable contains many additional sections; here we show only what is needed to evaluate format, depth, and rigor.
What's in the bundle
One curated section per phase — title page, PART I Strategic Context, plus a deep-dive that shows the depth of analysis
Market Intelligence
PART I Strategic Context + the Bottom-Up TAM/SAM/SOM deep-dive — full sizing methodology with 3-filter funnel.
Value Proposition Design
PART I Strategic Context + Three Kinds of Fit assessment showing problem-solution to product-market progression per vertical.
Messaging Architecture
PART I Strategic Context + Core Brand Platform — positioning statement, five proof pillars, declarative tagline.
Pitch Deck
PART I Deck Architecture + the Six Audience Configurations framework — one 15-slide spine, six narrator frames.
Sales Process & Playbook
PART I Strategic Context + Per-Vertical SPIN Conversation Flows showing technical-to-decision-confidence translation.
Pricing Strategy
PART I Strategic Context + the TCO Comparison deep-dive — Sagentix at 4-25% of top-tier strategy-firm cost.
Business Model
PART I Strategic Context + the Business Model Canvas — nine interlocking blocks turning consulting IP into recurring revenue.
Strategy & Execution
PART I Strategic Context + PART III the 90-Day Action Plan — three 30-day sprints, six operational KPIs.
Digital Audit
PART I Strategic Context + the Technical Audit Across Eight Dimensions — JSON-LD, robots.txt, GSC/GA4 instrumentation.
Evidence & Proof
PART I Strategic Context + the Cross-Phase Master Claims Table — 50+ claims with confidence ratings + legal-risk classification.
Why this matters for a B2B tech founder evaluating GTM advisors
The Trust Gap thesis behind every Sagentix deliverable
In 2026, "research-backed" and "data-driven" are claims every consultant makes. Most can't back them. AI-saturated content has trained buyers to discount unsourced statistics — what I call the Evidence Gap: the distance between "I think" and "the research shows."
The sample below is my attempt to close that gap structurally. Every quantitative claim carries an APA 7th in-text citation. Every figure is traceable to a source. The 16-point quality gate that ships every deliverable runs on this very sample before it lands in your inbox.
I built Sagentix because the B2B technology founders I work with — $2M–$50M ARR growth-stage companies and pre-revenue ideation founders — face a brutal false binary: pay $250K+ for a top-tier strategy firm engagement (12–16 weeks, Fortune 500 budgets), or DIY with AI tools (300+ founder hours, unverifiable data, no cross-phase integration).
Phase 1 is the risk reversal. CA$4K–$5K, 100% money-back guarantee. If the deliverable doesn't reveal something you didn't already know, you don't pay. This sample is what the format looks like before the content is yours.
The static PDF is one channel. The Intelligence Portal is the other.
Every Sagentix engagement is delivered as PDFs and DOCX — and as a live, branded Intelligence Portal where you read, search, review, and act on every phase. The Action Board turns 165 pages of research into 281 trackable cards.
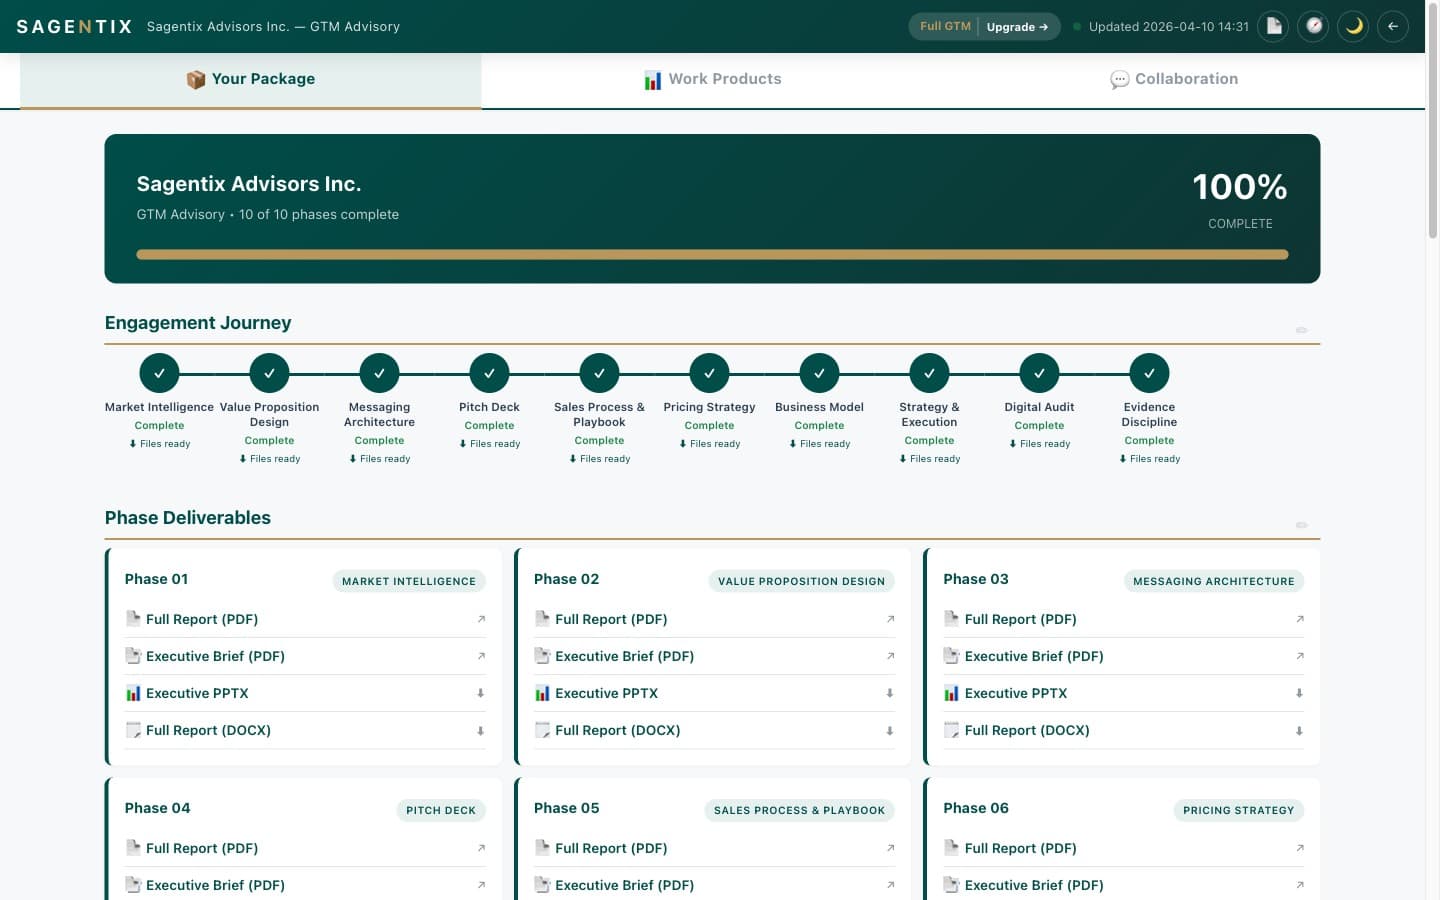
Tab 1 of 12
Engagement journey + phase deliverables
Top-level overview: 10-phase progress timeline, completion bar, and a card grid linking to every Phase Brief, full PDF, exec PPTX, and DOCX.
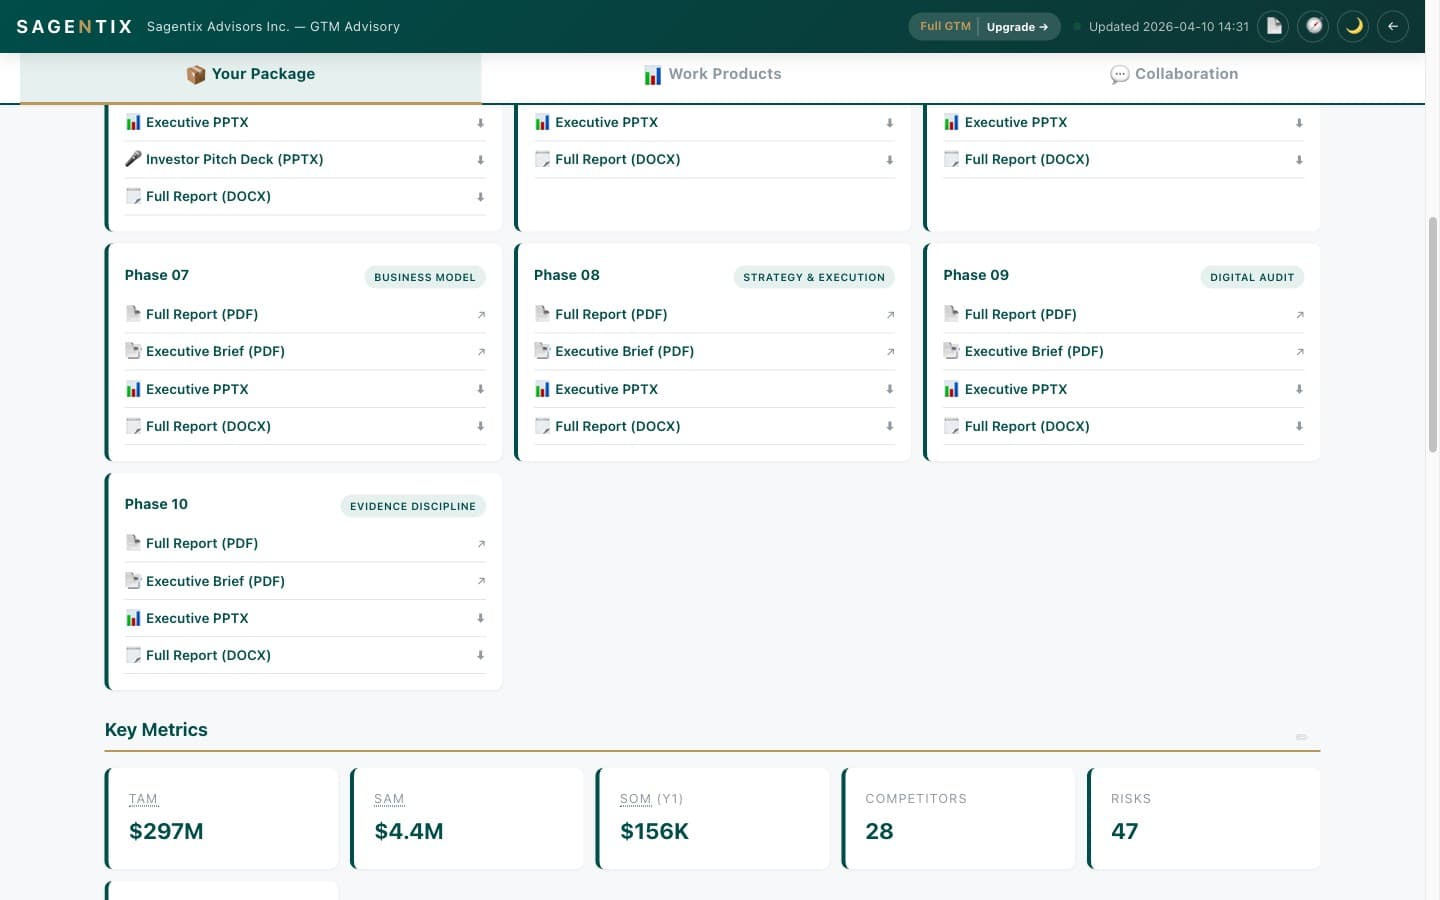
Tab 2 of 12
Headline metrics dashboard
TAM / SAM / SOM, competitor count, risk register, and data sources surfaced as live tiles. Every figure links back to its source phase.
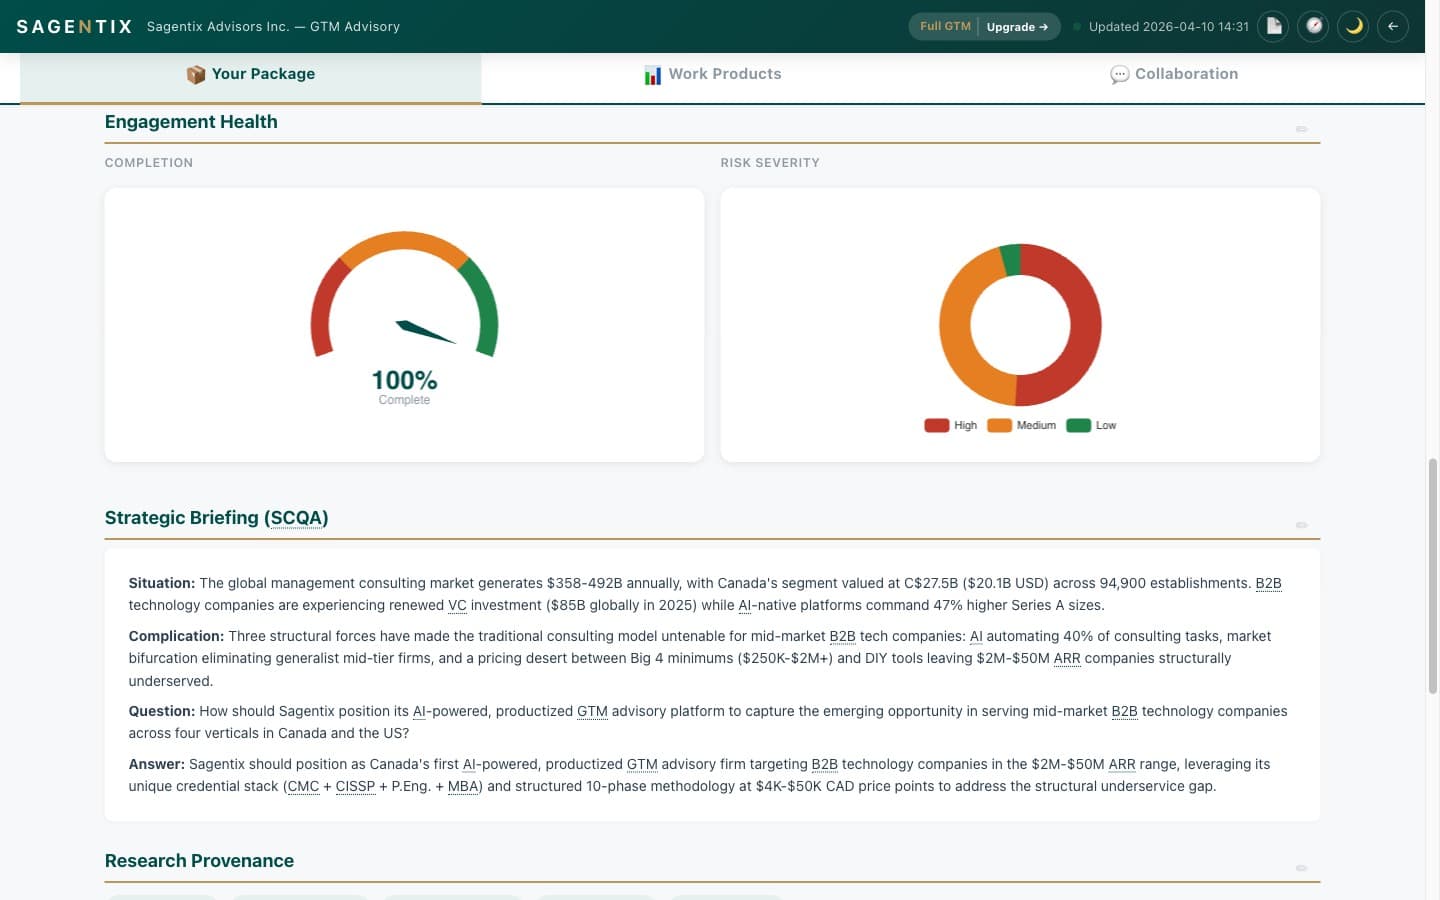
Tab 3 of 12
Engagement health + SCQA briefing
Pyramid Principle SCQA briefing, completion gauge, and risk severity donut — the 60-second answer for an executive who only has one minute.
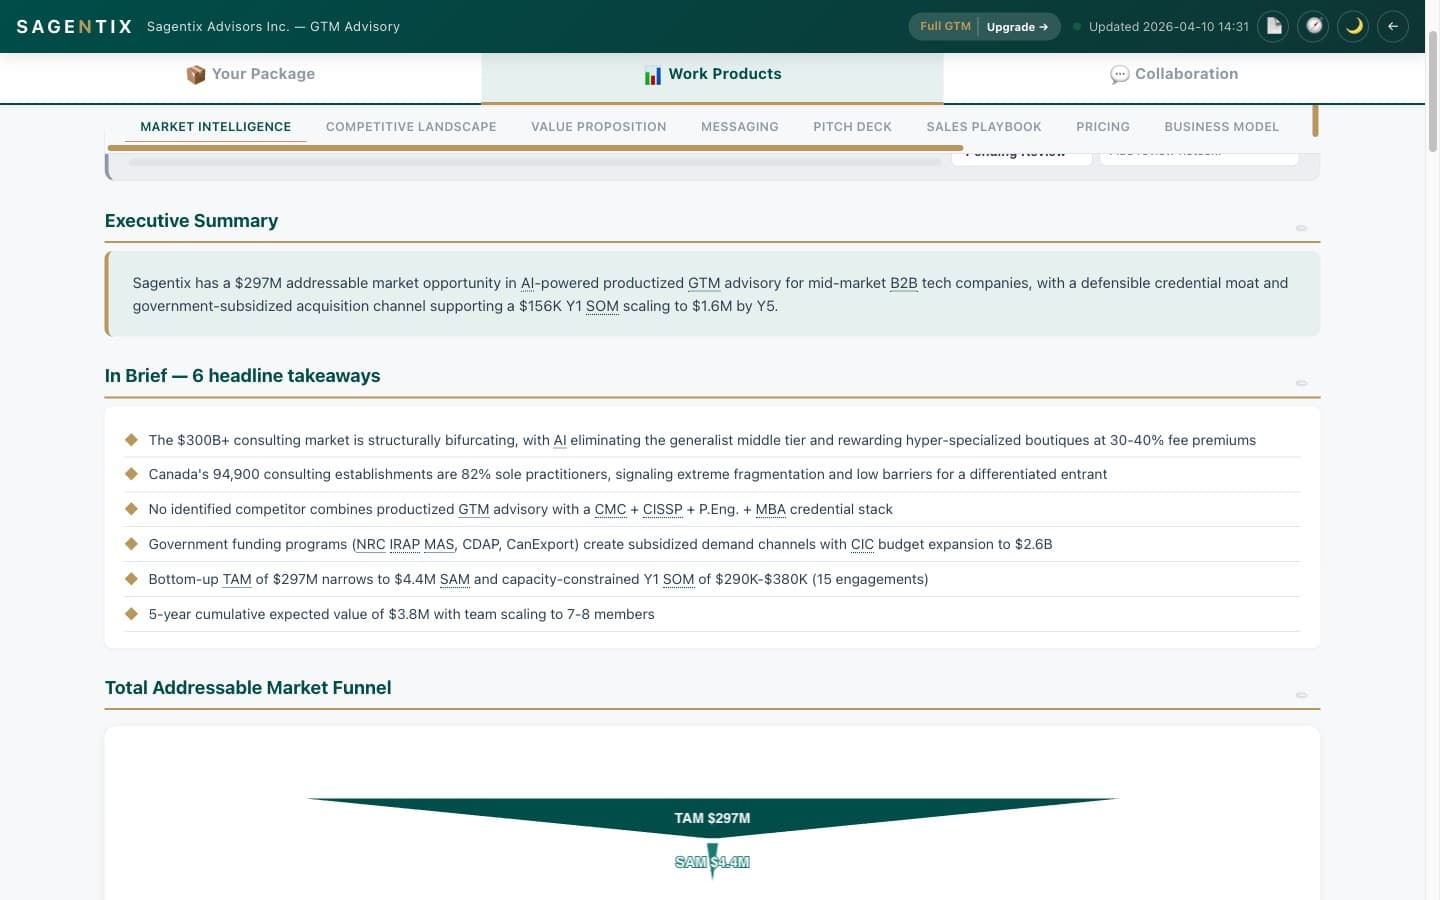
Tab 4 of 12
Market Intelligence (Phase 01)
Executive Summary, In Brief headline takeaways, and an interactive TAM funnel rendered directly from the phase deliverable — no separate dashboard build required.
Tab 5 of 12
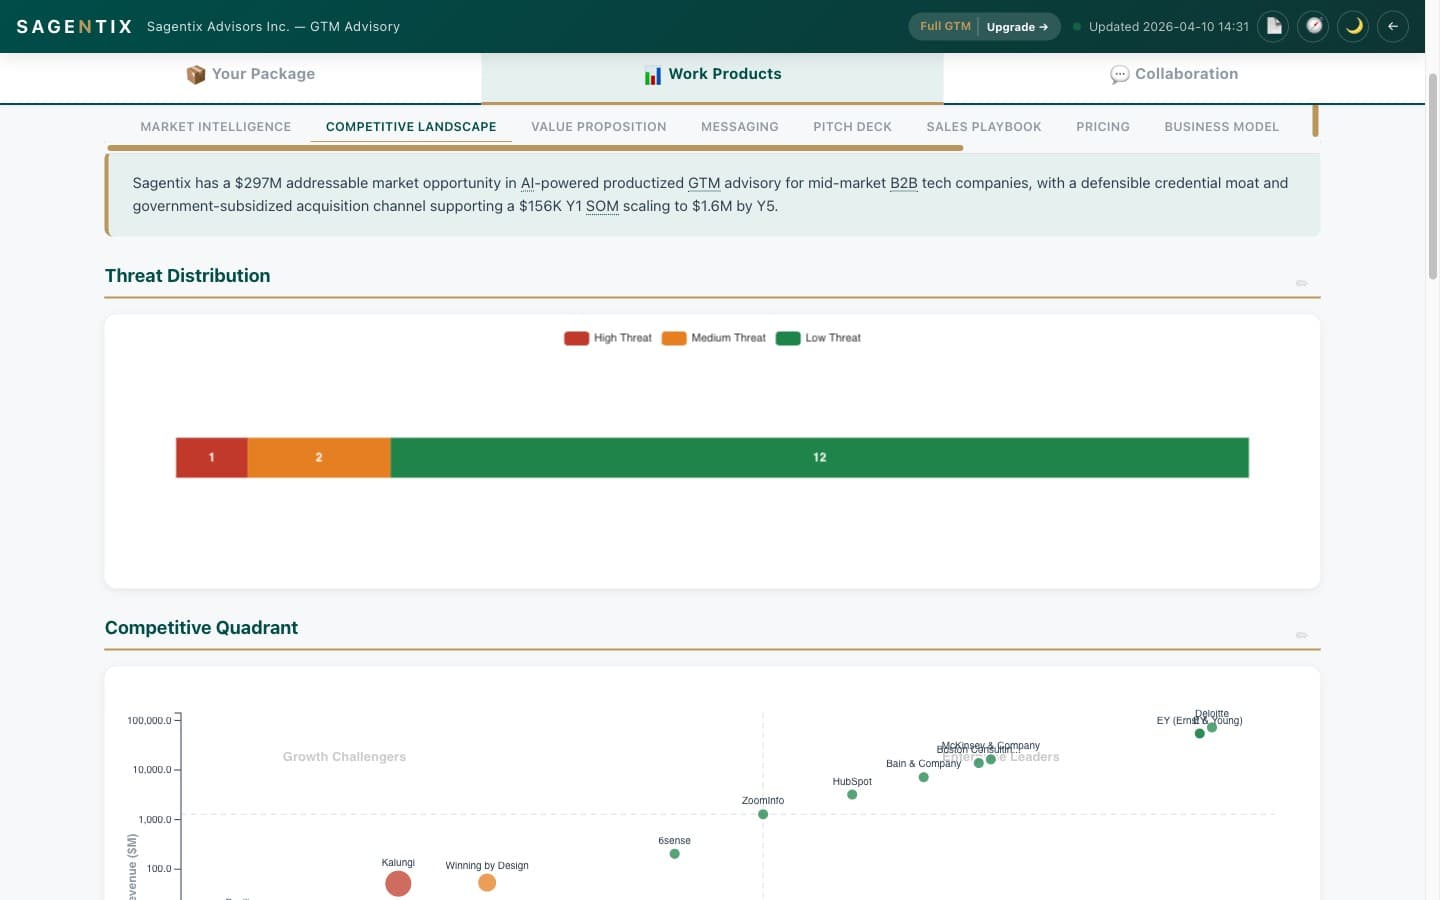
Competitive Landscape
Threat distribution and a competitive quadrant scatter, populated from the Phase 01 evidence ledger. Click any competitor to see the source citation.
Tab 6 of 12
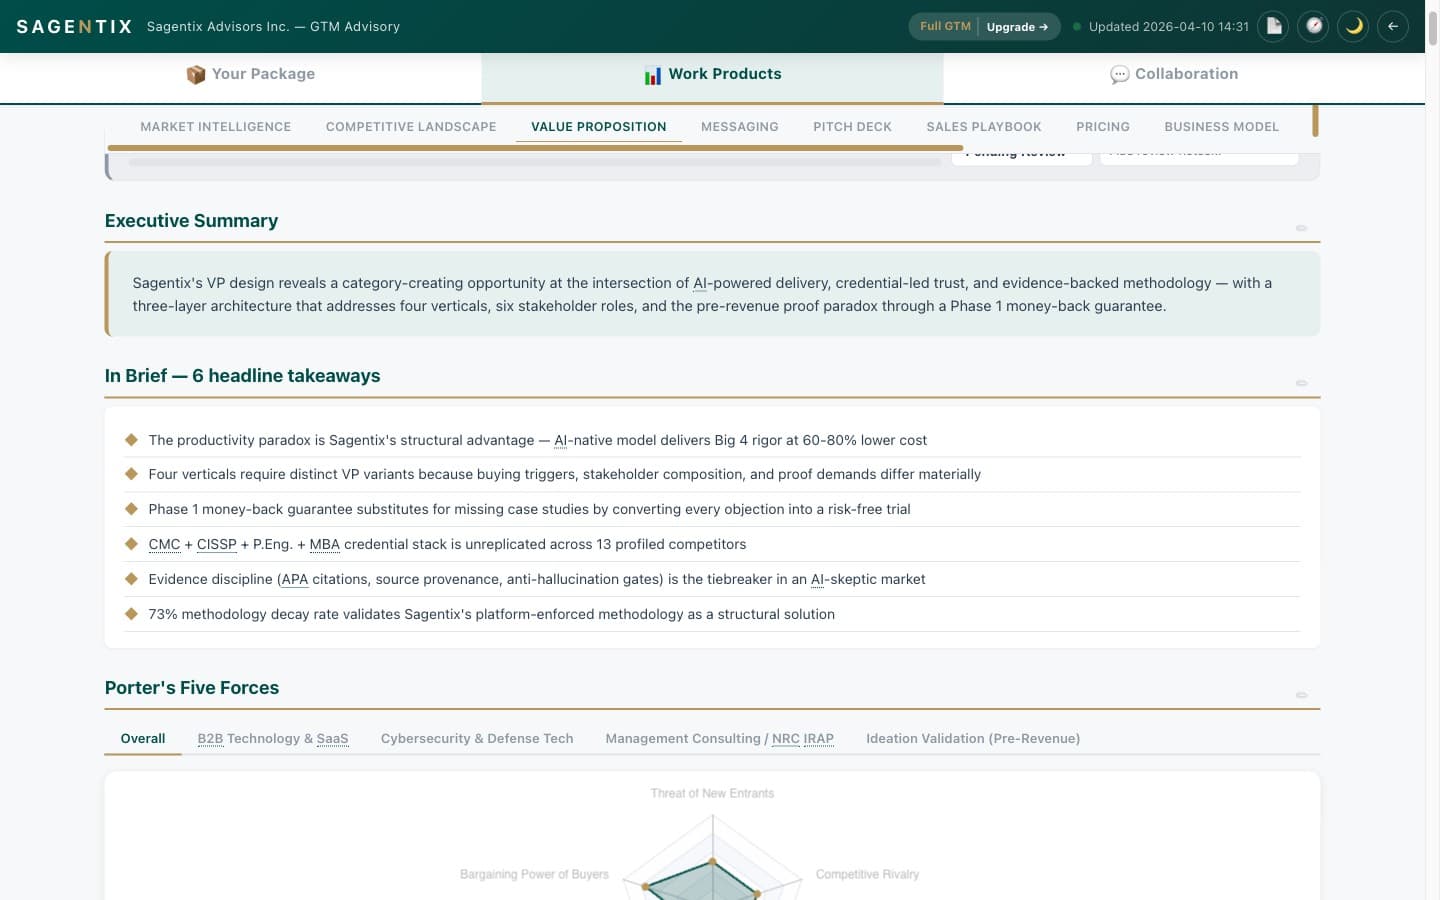
Value Proposition (Phase 02)
Six headline takeaways plus interactive Porter’s Five Forces tabs. Each force pulls its scoring rationale from the phase draft.
Tab 7 of 12
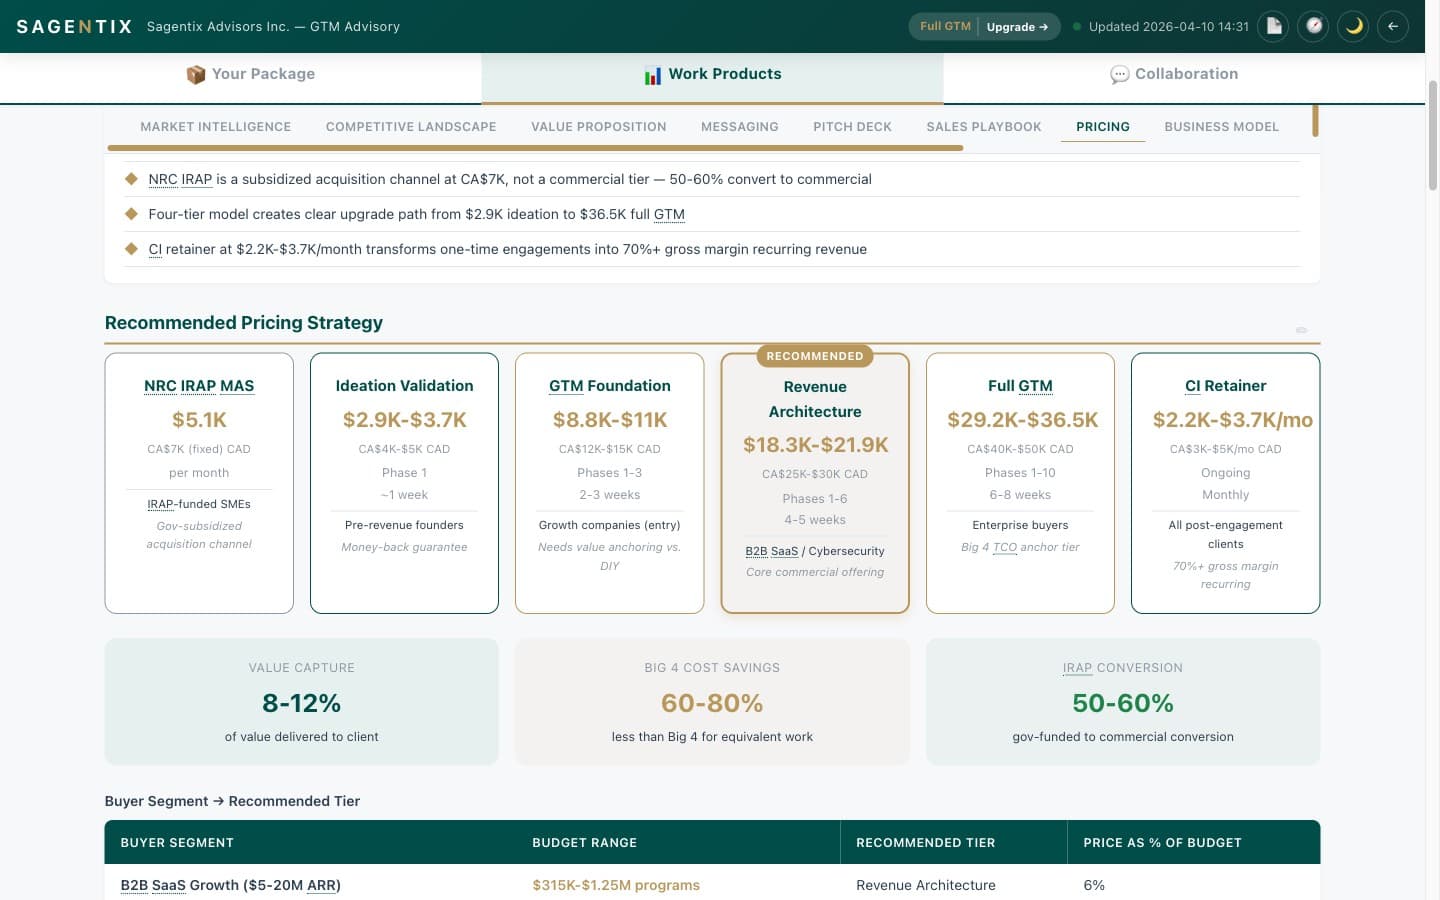
Pricing Strategy (Phase 06)
Tiered pricing cards — Ideation Validation, GTM Foundation, Revenue Architecture (Recommended), Full GTM, CI Retainer — with value-capture, cost-savings, and conversion metrics.
Tab 8 of 12
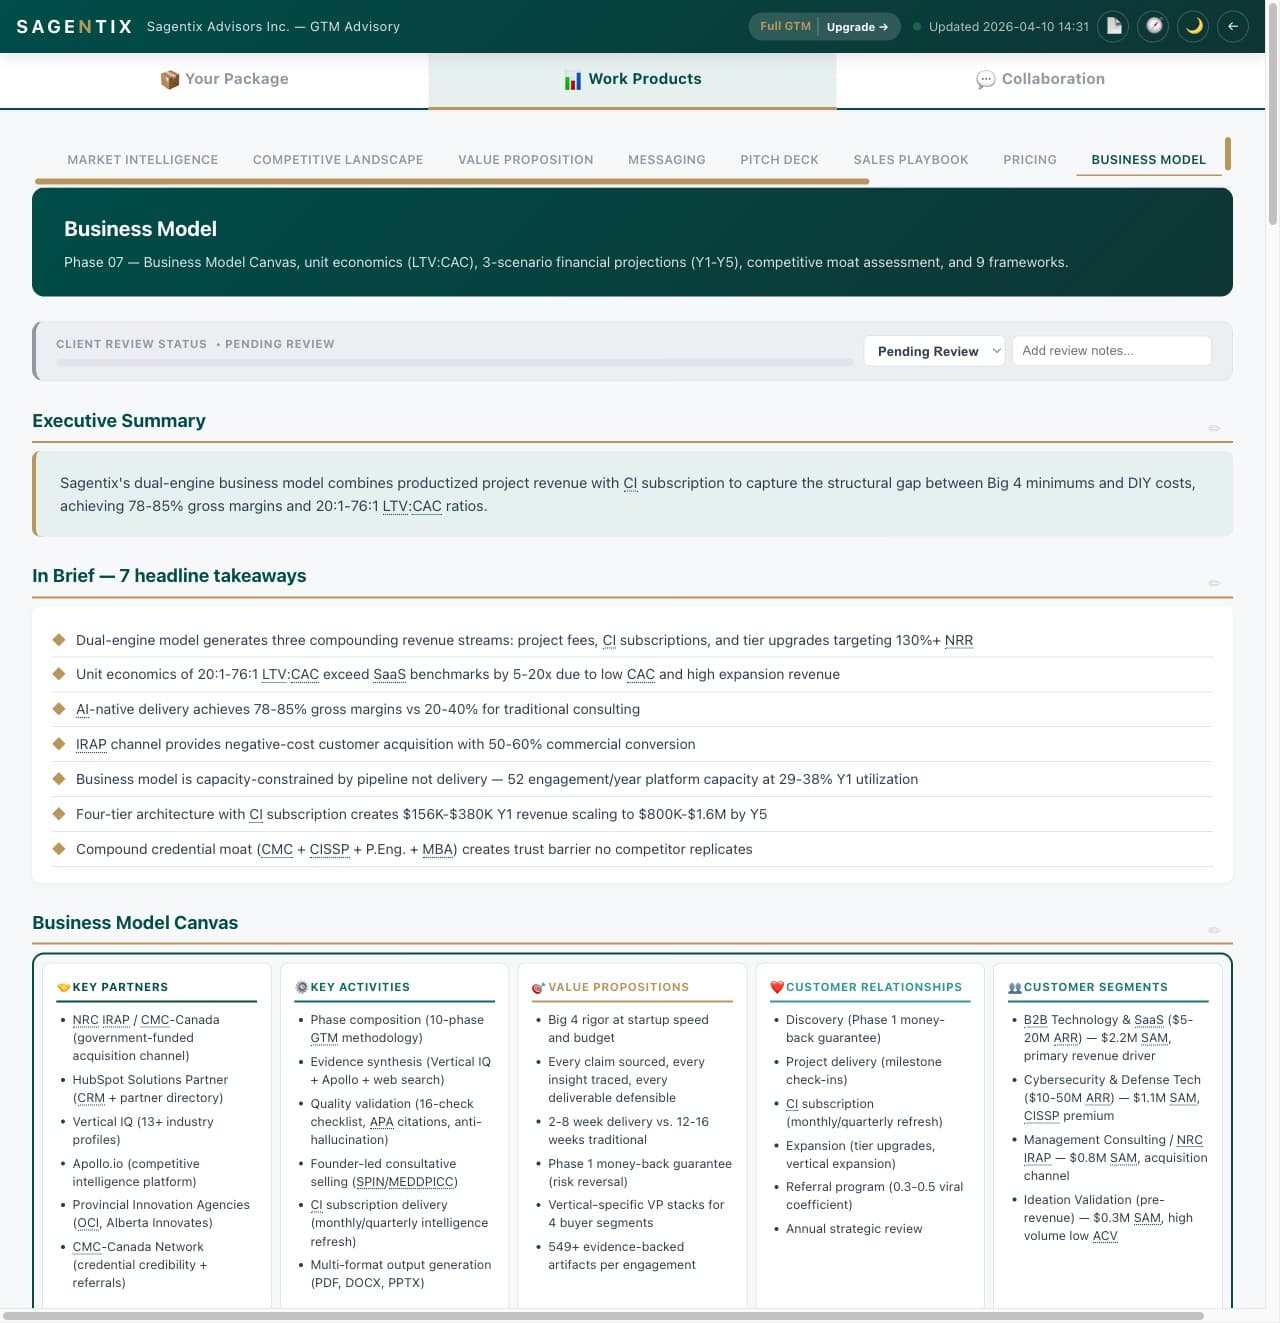
Business Model (Phase 07)
Business Model Canvas with all nine blocks populated, unit-economics In Brief takeaways, and a live-tracking review status bar.
Tab 9 of 12
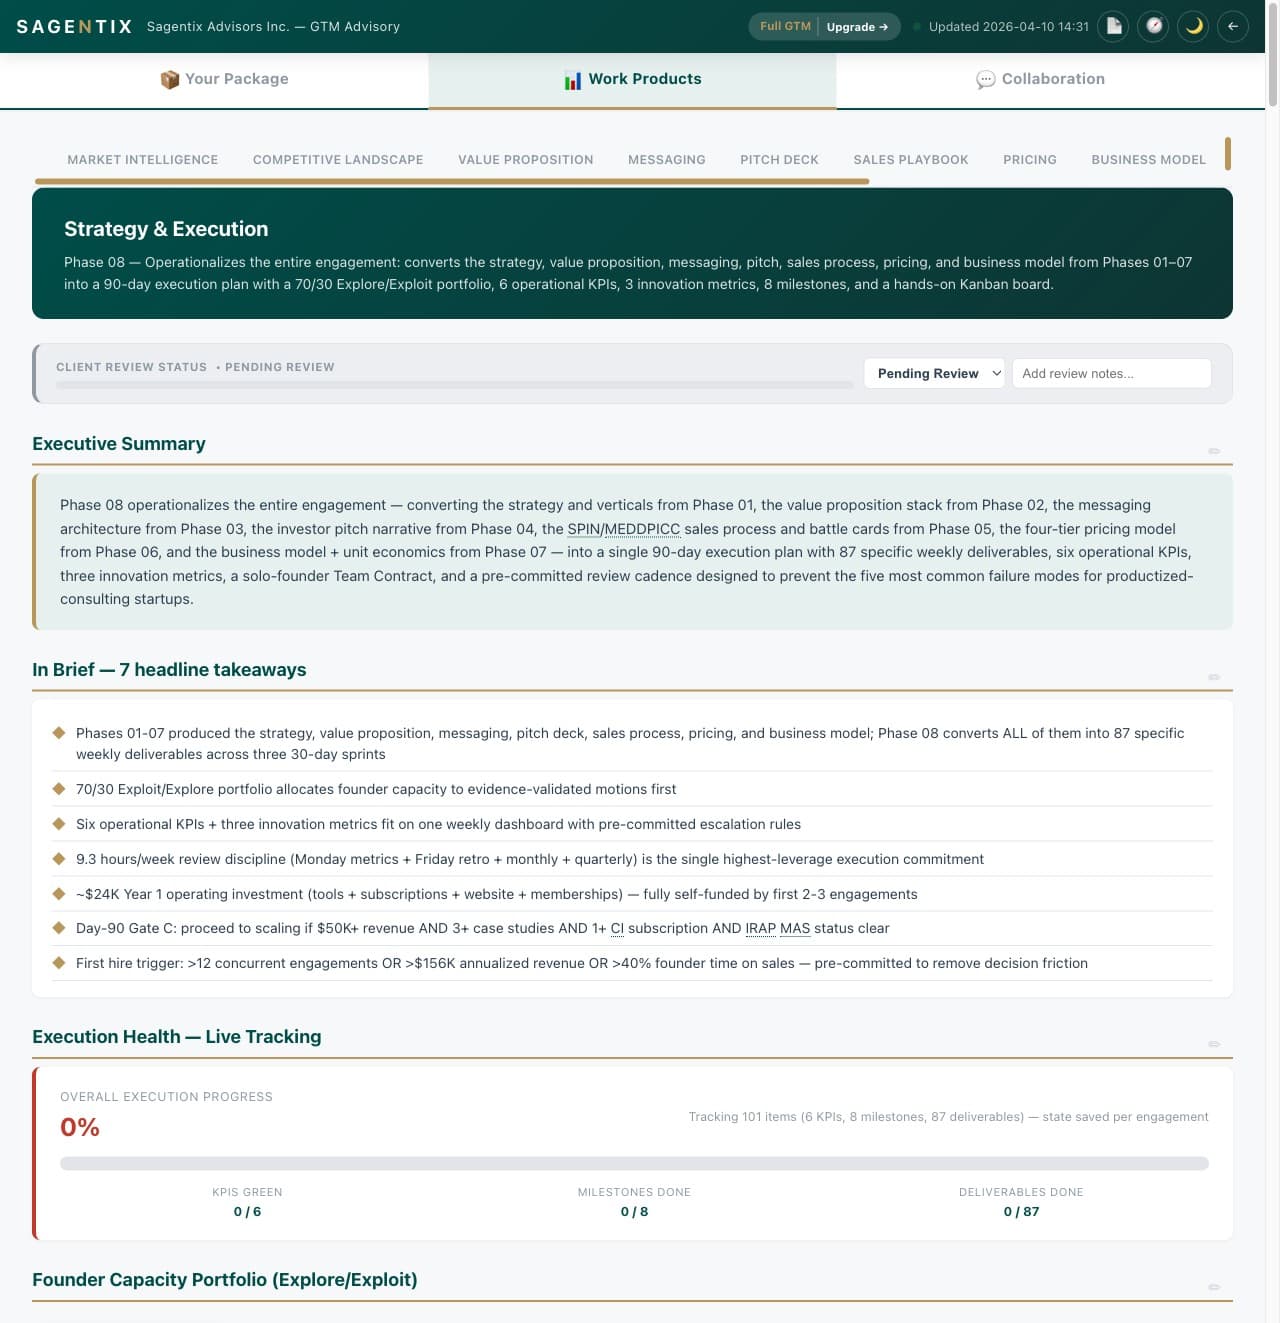
Strategy & Execution (Phase 08)
90-day sprint plan, six operational KPIs, three innovation metrics, and live execution-progress tracking against 87 weekly deliverables.
Tab 10 of 12
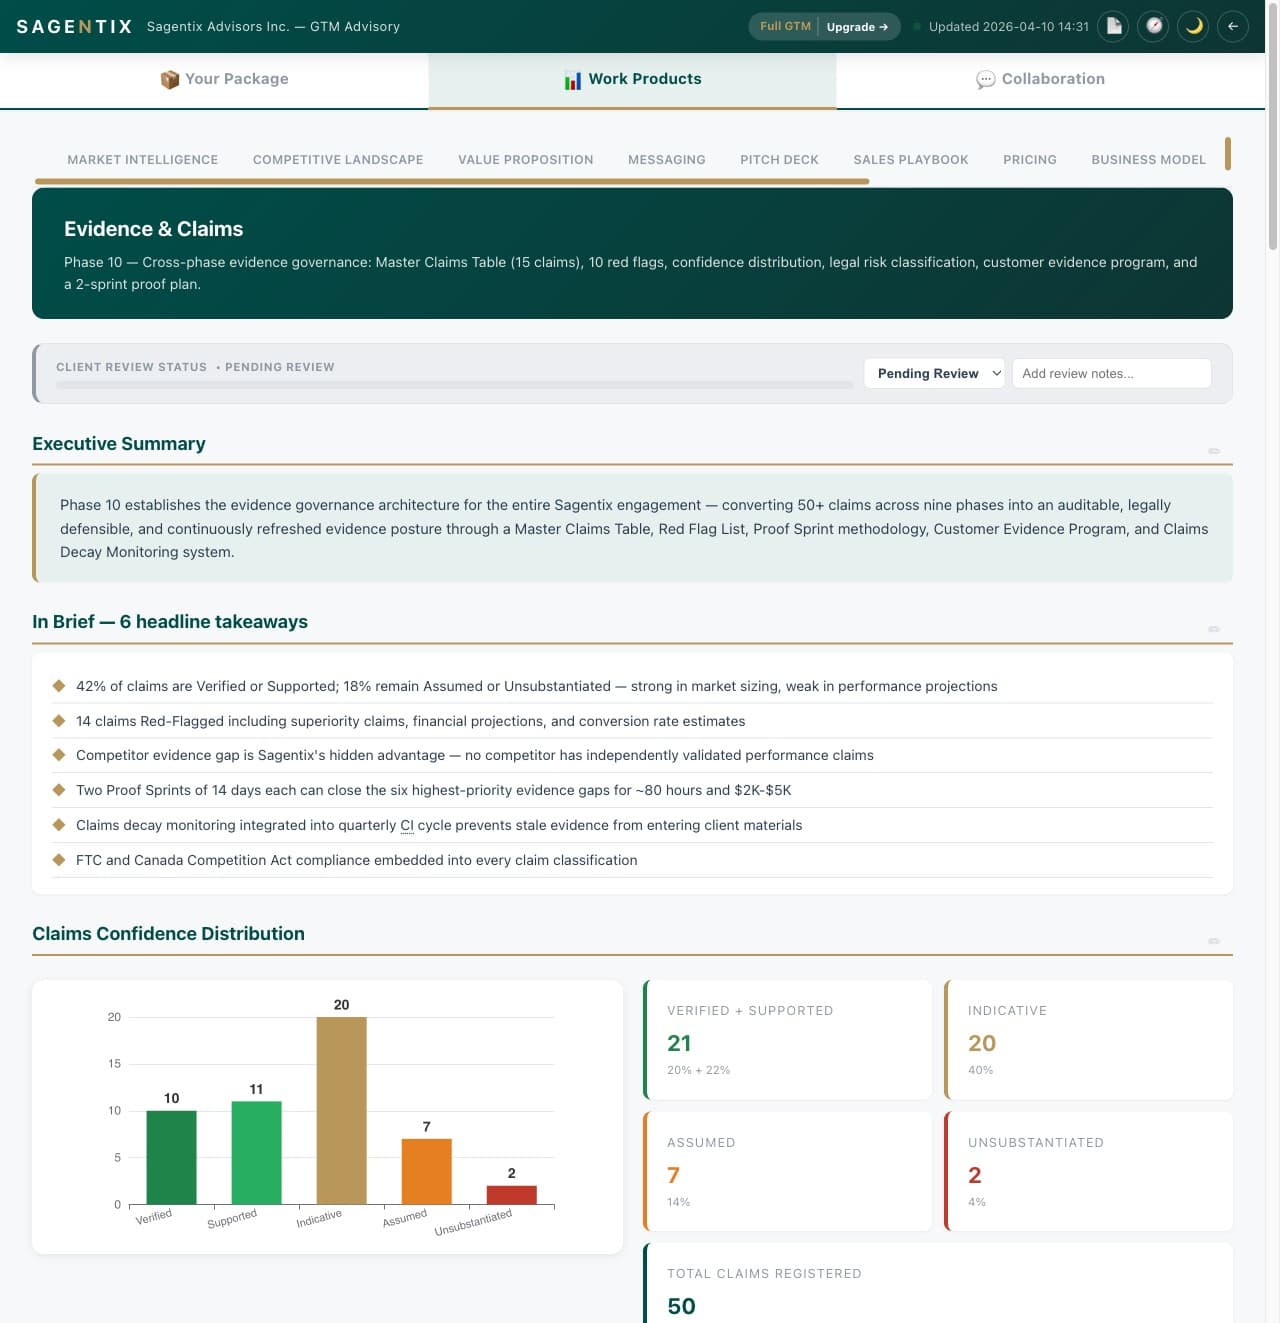
Evidence & Claims (Phase 10)
Master Claims Table with 50 registered claims classified Verified → Supported → Indicative → Assumed → Unsubstantiated — the proof discipline behind every figure.
Tab 11 of 12
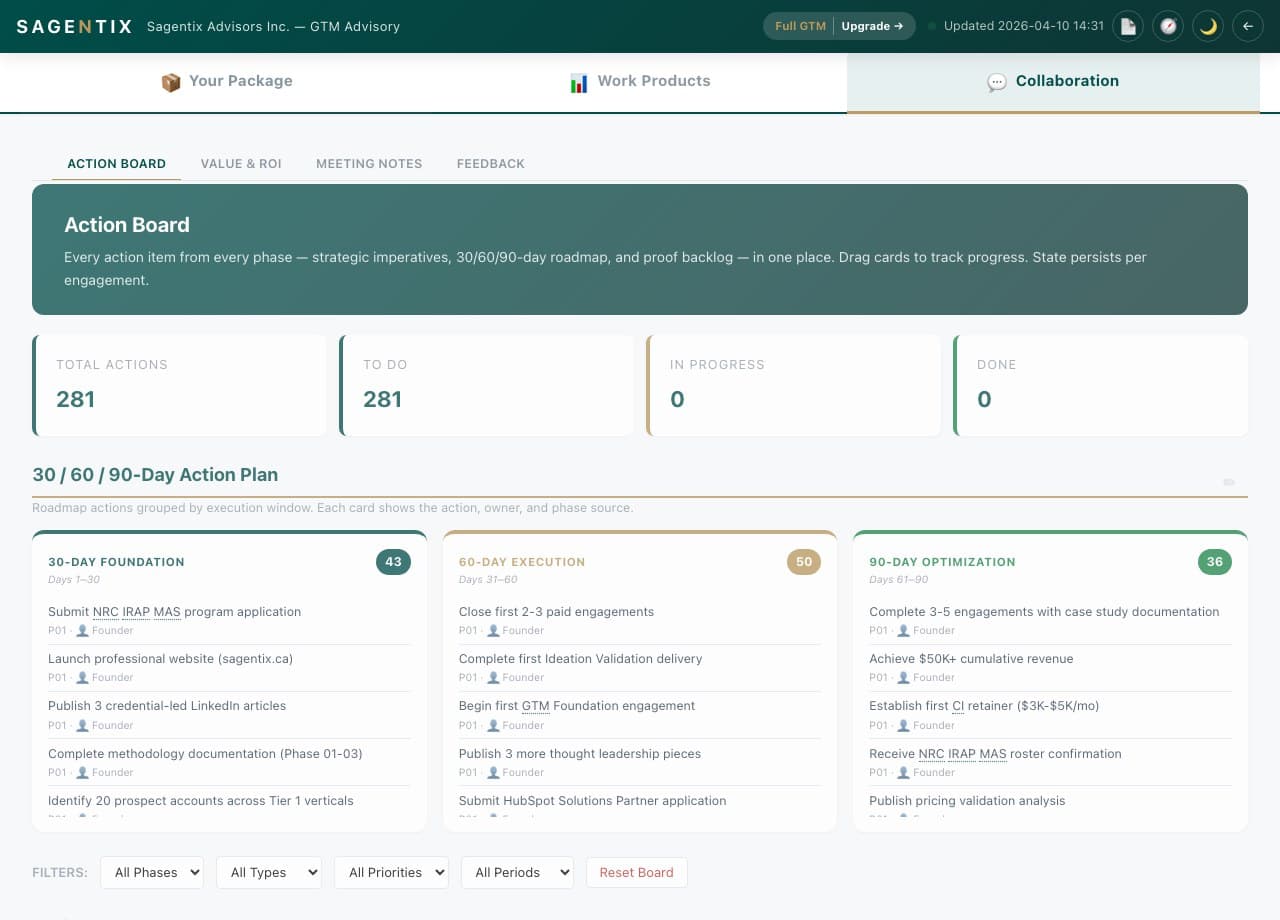
Action Board — 30/60/90-Day Plan
Every action item from every phase rolled into one cross-engagement view. 281 actions split across 30-Day Foundation (43), 60-Day Execution (50), and 90-Day Optimization (36) — each card carries its phase source, owner, and budget.
Tab 12 of 12
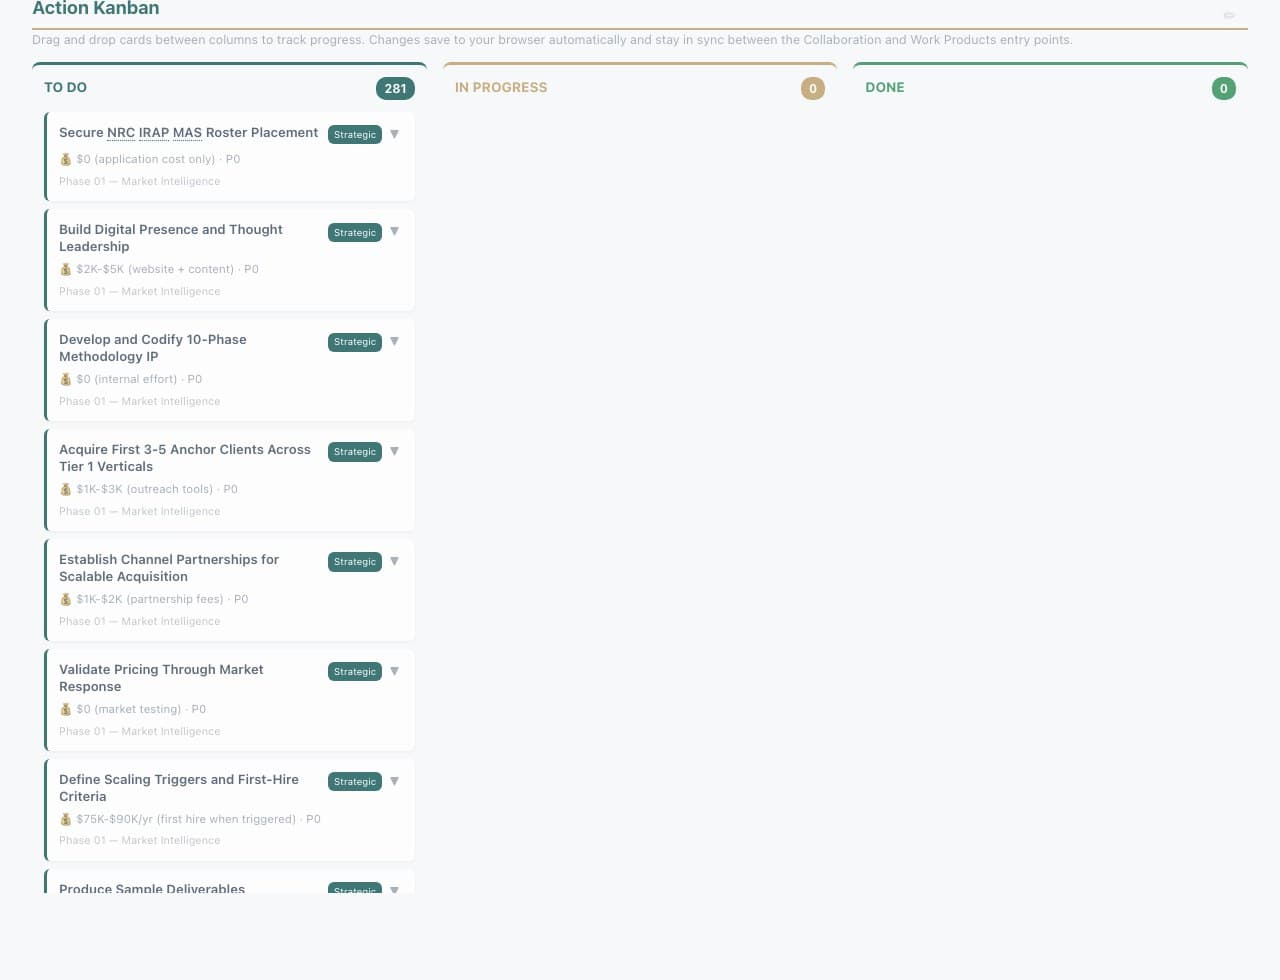
Action Kanban — drag, track, ship
The same 281 actions in a TO DO / IN PROGRESS / DONE kanban. Cards persist per engagement and stay in sync with the 30/60/90 plan. This is what makes the research actionable, not just readable.
Screenshots are from the Sagentix internal reference engagement (Sagentix_GTM_2026Q1) — the same portal a paying client receives, populated with my own firm's data. Use the arrows or dots to scroll all 12 screens — the last two show the Action Board that turns research into a kanban.
How portal access works — and how your data is protected
The portal is private by default. Here is exactly how access is granted and how engagement data is handled.
Magic-link access — no shared logins
When your engagement starts, I whitelist the work email addresses you authorize. Each authorized teammate gets a one-click magic-link sent to that email. There are no shared passwords, no public URLs, no third-party identity providers to configure.
One portal per engagement, scoped to your data only
Every engagement gets its own isolated portal URL and its own data folder. Your portal never references — and cannot link to — any other client's engagement. There is no multi-tenant shared database.
Mutual NDA before any data leaves your inbox
Every Sagentix engagement is covered by a mutual NDA signed before kickoff. I carry professional indemnity (E&O) and cyber liability insurance (CFC Underwriting; certificate of insurance available to your risk and compliance team on request).
Data minimization — I only ask for what I need
I do not request CRM exports, customer PII, or financial system access unless a phase explicitly requires it. When required, the data stays inside your engagement folder and is purged on request at end of engagement.
What you can verify before engaging: the screenshots above are from the Sagentix internal reference portal — populated with my own firm's data, so you can inspect format and rigor without any other client's information being involved. On a 30-minute scoping call I can walk you through the live portal in real time and answer any security or governance question your team has.
The 16-point quality gate
What runs on every deliverable, every time
Source-integrity verification on every claim
APA 7th in-text citation count and density
Regulatory terminology check (Competition Act §52/74.01)
Cross-phase consistency audit
Anti-hallucination gate against knowledge-validation searches
Unfilled placeholder + proof-marker scan
Structural completeness against deliverable skeleton
Subscription-data utilization check
Document architecture conformance (G1–G16)
+ 7 additional structural and evidence checks
How to read the sample. Open the PDF and scan for two things: APA-style in-text citations attached to every quantitative claim, and the per-phase evidence ledger that traces each load-bearing claim to its source. If you've read consulting deliverables before, the difference is immediate.
CMC · CISSP · P.Eng. · MBA
Verifiable founder credentials. CMC-Canada protected designation.
727+ IP artifacts
Frameworks, prompts, evidence tables, and 97 curated VerticalIQ industry profiles.
100% money-back
Phase 1 PoC at CA$4K–$5K. If it doesn't reveal something new, you don't pay.
Read the sample. Then book a 30-minute scoping call.
The fastest way to test whether evidence-backed GTM beats opinion-based GTM is to do one Phase 1.
Working URL for sharing: sagentix.ca/sample